(EDA)파이썬을 이용한 탐색적 데이터 분석 프로젝트
Kaggle의 Google Play 스토어 데이터 세트에서 EDA 수행
탐색적 데이터 분석(EDA):
EDA(Exploratory data analysis)는
모든 데이터 분석에서 중요한 단계입니다.
EDA는 데이터 세트에 대한 이해를 바탕으로
패턴 및 이상치(outlier)를 발견하고,
가설을 세우기 위해 데이터 세트를
탐색하는 프로세스입니다.
EDA는 데이터 세트의
수치 데이터에 대한 요약 통계를 생성하고,
데이터를 더 잘 이해하기 위해
다양한 그래픽 표현을 생성하는 것을 포함합니다.
이번 포스팅에서는 Python을 이용해서
예제 데이터 세트를 가지고
EDA의 과정을 처음부터 끝까지
수행해 보겠습니다.
사용하고자 하는 Python library는
Pandas, Numpy, matplotlib, seaborn 및
opendatasets 라이브러리입니다.
여기에서 사용하는 데이터 세트는
Play 스토어의 앱에 대한 세부 정보를 포함하는
Google Playstore 데이터 세트입니다.
Play 스토어에는 10,0000개 이상의 앱이 있습니다.
데이터 세트의 크기는 Kaggle에서 가져온 210Mb입니다.
프로젝트 목적
프로젝트의 목적은 EDA 개념을 이해하는 것이며,
이 프로젝트의 주요 주제는 통찰력을 제공하여
고객 요구를 더 잘 이해하여 개발자가 제품(앱)을
대중화할 수 있도록 돕는 것입니다.
프로젝트의 단계별 개요는 다음과 같습니다.
- Kaggle에서 데이터 세트 다운로드
- 데이터 준비 및 정리
- 탐색적 분석 및 시각화
- 질문과 답변
- 요약 및 결론
Kaggle에서 데이터세트 다운로드
아래 링크에 접속하여 데이터를 다운로드합니다.
https://www.kaggle.com/datasets/gauthamp10/google-playstore-apps
데이터 준비 및 정리
여기에서 데이터 세트를
1) 데이터 프레임에 로드하고,
2) 데이터의 열과 행을 보고,
3) 데이터 세트 내부 항목에 대해
기술 통계 수행 및 확인
4) 누락된 값을 찾고,
5) 행을 복제합니다.
import pandas as pd
import numpy as np
import matplotlib.pyplot as plt
import seaborn as sns
# 1) 데이터 프레임으로 로드
googlePlaystoreData = pd.read_csv("D:/Python_apply/Google-Playstore_csv/Google-Playstore.csv")
# 2) 데이터의 행과 열 확인
googlePlaystoreData.shape

데이터는 2312944의 행과 24개의 열로
구성되어 있음
# 3) 기술 통계 수행 및 확인
googlePlaystoreData.describe()

# 4) 누락된 값이 있는 항목과 누락된 개수 찾기
missingCnt = [(googlePlaystoreData.columns[idx], missing)
for idx, missing in enumerate(googlePlaystoreData.isnull().sum())
if missing > 0]
missingCnt.sort(key = lambda x: -x[1])
for feature in missingCnt:
print(f"{feature[0]:20} => ",feature[1])

탐색적 분석 및 시각화
각 feature(숫자 및 범주형 모두)를 탐색하고,
그래프로 표현하고, null 값을 처리하고,
관찰을 작성합니다.
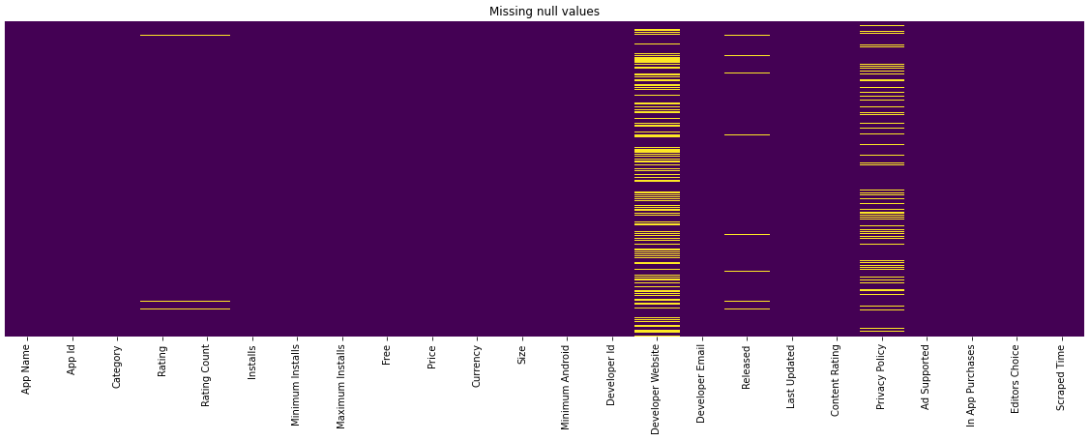
결측 값 시각화:
import matplotlib
matplotlib.rcParams['figure.figsize'] = (20,6)
import matplotlib.pyplot as plt
import seaborn as sns
sns.heatmap(googlePlaystoreData.isnull(), yticklabels = False, cbar = False , cmap = 'viridis')
plt.title("Missing null values")
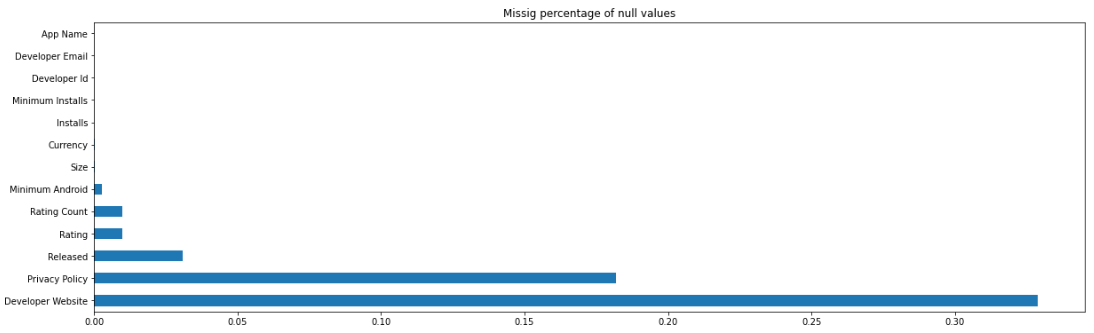
결측치 비율 그래프 표현하기:
missing_percentage = googlePlaystoreData.isnull().mean()[googlePlaystoreData.isnull().mean() > 0]
missing_percentage.sort_values(ascending = False, inplace = True)
import matplotlib
matplotlib.rcParams['figure.figsize'] = (20,6)
missing_percentage.plot(kind = 'barh')
plt.title("Missig percentage of null values")
탐색:
null 값 다루기
1. null 값 비율이 가장 높은 열은 아래 두 항목임:
- Developer Website
- Privacy Policy
이러한 feature는 삭제하는 것이 좋아요.
2. 열에 대한 작은 null 값을 삭제할 수 있습니다.
- Size
- Currency
- Installs
- Minimum Installs
- Developer Id
- Developer Email
3. Rating,Rating Count, Released는 중요한 feature이므로
null값을 채우는 것이 좋고요.
- Rating
- Rating count
- Minimum Andriod
- Released
null 값 삭제:
googlePlaystoreData.dropna(
subset = ['App Name','Size','Currency','Installs',
'Minimum Installs','Developer Id','Developer Email'], inplace = True
)
feature 탐색:
' Installs' feature, 이 feature는
Google Play 스토어 데이터 세트의
각 애플리케이션에 대해 수행된
설치 수에 대한 정보를 가지고 있습니다.
googlePlaystoreData['Installs'].unique()
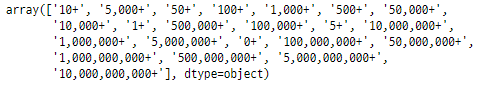
"Installs" feature
데이터 형식이 범주형입니다.
해당 항목은 정수형이어야 하지만,
'이상'을 표현하기 위해 '+' 기호를 결합하여
결론적으로는 범주형으로 변경된 것으로
판단됩니다.
"Installs" 수는 정수여야 하기 때문입니다.
# + 기호 제거
googlePlaystoreData['Installs'] = googlePlaystoreData['Installs'].str.split('+').str[0]
# ',' -> '' 대체
googlePlaystoreData['Installs'] = googlePlaystoreData['Installs'].str.replace(',','', regex = True)
# 정수형 변환
googlePlaystoreData['Installs'] = googlePlaystoreData['Installs'].astype("int64")
"+" 기호, " , "(쉼표)를 제거한 다음
정수 유형으로 변환했습니다.
' Size ' feature
이 feature는 Google Play
스토어 데이터셋에 있는
각 애플리케이션의 크기에 대한
정보를 가지고 있습니다.
googlePlaystoreData['Size'].unique()

' Size ' feature
데이터의 단위가
KB, MB, GB일 수 있기 때문에,
크기를 MB로 통일하겠습니다.
1) 'M' 제거하기
googlePlaystoreData['Size'] = googlePlaystoreData['Size'].apply(lambda x: str(x).replace('M', '')
if 'M' in str(x) else x)
2) KB를 MB로 변환하기 위해 'K' 제거하기
googlePlaystoreData['Size'] = googlePlaystoreData['Size'].str.replace(',','', regex = True)
googlePlaystoreData['Size'] = googlePlaystoreData['Size'].apply(lambda x: float(str(x).replace('k', '')) / 1000
if 'k' in str(x) else x)
3) GB를 MB로 변환하기 위해 'G' 제거하기
googlePlaystoreData['Size'] = googlePlaystoreData['Size'].apply(lambda x: float(str(x).replace('G', '')) * 1000
if 'G' in str(x) else x)
4) Size feature를 float 유형으로 변환
googlePlaystoreData['Size'] = googlePlaystoreData['Size'].apply(lambda x: float(x))
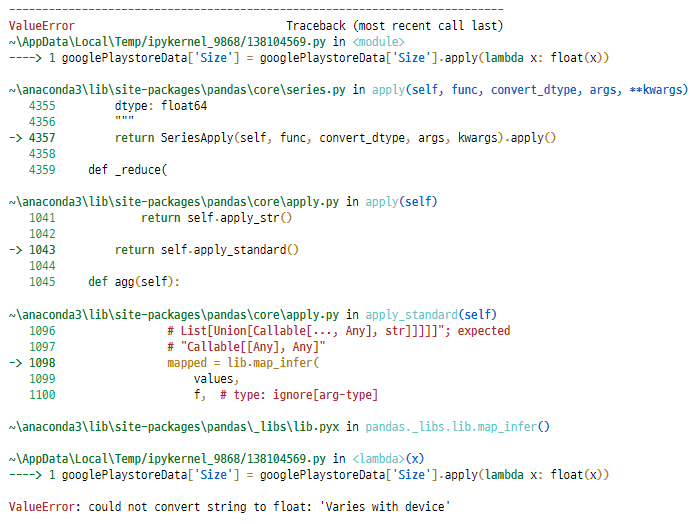
엇! 에러가 발생하네요.
에러 내용을 보니, 'Size' feature에
'Varies with device'라는 값이
들어가 있는 것 같네요.
googlePlaystoreData[googlePlaystoreData['Size'] == 'Varies with device'][['Size']]
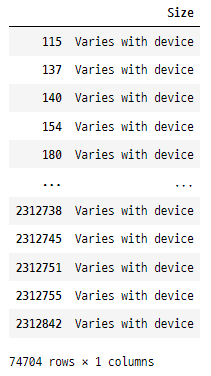
74704개의 데이터에 정말
'Varies with device'라는 값이 들어가 있어요.
대체 불가능하여 삭제하겠습니다.
googlePlaystoreData = googlePlaystoreData[googlePlaystoreData['Size'] != 'Varies with device']
이제, Size feature를 float 유형으로
변환해 보겠습니다.
googlePlaystoreData ['Size'] = googlePlaystoreData ['Size'].apply(lambda x: float(x))
‘ Free ’ feature
이 feature는 Google Play 스토어
데이터 세트 날씨에 있는
각 애플리케이션의 유형에 대한 정보가
유료 또는 무료로 제공됩니다.
googlePlaystoreData ['Free']
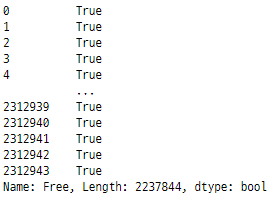
‘ Free ’ feature는 bool 형이므로
bool True False를 무료 및 유료로 변경하여
추가 분석이 용이하도록 하겠습니다.
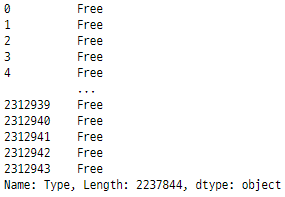
import numpy as np
googlePlaystoreData['Type'] = np.where(googlePlaystoreData['Free'] == True,'Free','Paid')
googlePlaystoreData.drop(['Free'],axis=1, inplace= True )
googlePlaystoreData['Type']
‘ Content Rating ’ feature
이 feature는 청소년, 성인, 성인, 모든 사람, 10세 이상,
등급 없음과 같은 일부 범주가 있으며
다양한 연령대의 정보를 제공합니다.
googlePlaystoreData['Content Rating'].unique()

이러한 범주를 청소년, 성인 및
모든 사람과 같은 간단한 3가지 범주로
만들 수 있습니다.
googlePlaystoreData["Content Rating"] = googlePlaystoreData["Content Rating"].replace("Unrated","Everyone")
googlePlaystoreData["Content Rating"] = googlePlaystoreData["Content Rating"].replace("Everyone 10+","Teen")
googlePlaystoreData["Content Rating"] = googlePlaystoreData["Content Rating"].replace("Mature 17+","Adults")
googlePlaystoreData["Content Rating"] = googlePlaystoreData["Content Rating"].replace("Adults only 18+","Adults")
‘ Rating Count ’ feature
이 feature는 각 응용 프로그램의
평가 횟수에 대한 정보를 제공합니다.
googlePlaystoreData['Rating Count'].unique()

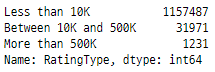
평가 횟수입니다.
0 카운트는 '등급 없음',
<1000은 '10k 미만',
'10k에서 500k 사이', '500k 이상'과 같이
횟수를 분류할 수 있습니다.
googlePlaystoreData['Rating Type'] = 'NoRatingProvided'
googlePlaystoreData.loc[(googlePlaystoreData['Rating Count'] > 0) &
(googlePlaystoreData['Rating Count'] <= 10000.0),'RatingType'] = 'Less than 10K'
googlePlaystoreData.loc[(googlePlaystoreData['Rating Count'] > 10000) &
(googlePlaystoreData['Rating Count'] <= 500000.0),'RatingType'] = 'Between 10K and 500K'
googlePlaystoreData.loc[(googlePlaystoreData['Rating Count'] > 500000) &
(googlePlaystoreData['Rating Count'] <= 138557570.0),'RatingType'] = 'More than 500K'
googlePlaystoreData.RatingType.value_counts()
질문(Q)과 답변(A), 그리고 시각화
Google Play 스토어에서 설치되는
상위 10개 카테고리는 무엇입니까?
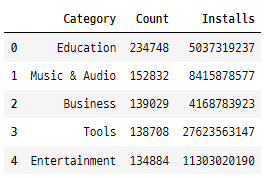
top_Category = (googlePlaystoreData.Category
.value_counts()
.reset_index()
.rename(columns={'Category':'Count','index':'Category'}))
Category_installs = googlePlaystoreData.groupby(['Category'])[['Installs']].sum()
top_Category_installs = pd.merge(top_Category, Category_installs, on='Category')
top_Category_installs.head(5)
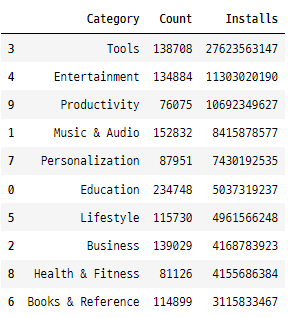
top_10_Categories_installs = top_Category_installs.head(10).sort_values(by = ['Installs'],ascending = False)
top_10_Categories_installs
plt.figure(figsize=(14,7))
plt.xticks(rotation=60)
plt.xlabel("Category")
plt.ylabel("Number of applications")
plt.title("Top 10 Installed Categories")
sns.barplot(x = top_10_Categories_installs.Category,y = top_10_Categories_installs.Installs)

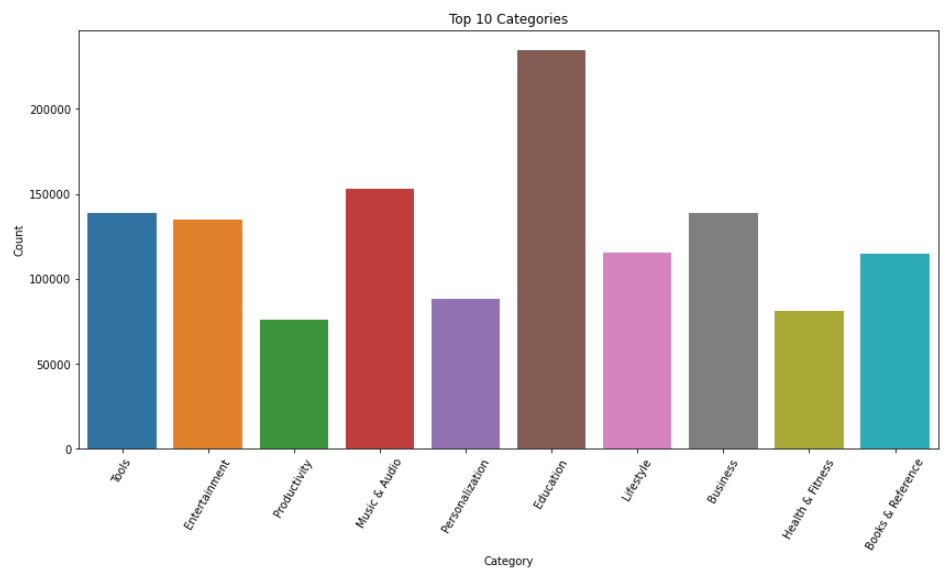
Play 스토어에서 가장 많은 수의
상위 10개 카테고리는 무엇입니까?
plt.figure(figsize=(14,7))
plt.xticks(rotation=60)
plt.xlabel("Category")
plt.ylabel("Number of applications")
plt.title("Top 10 Categories")
sns.barplot(x = top_10_Categories_installs.Category, y = top_10_Categories_installs.Count)
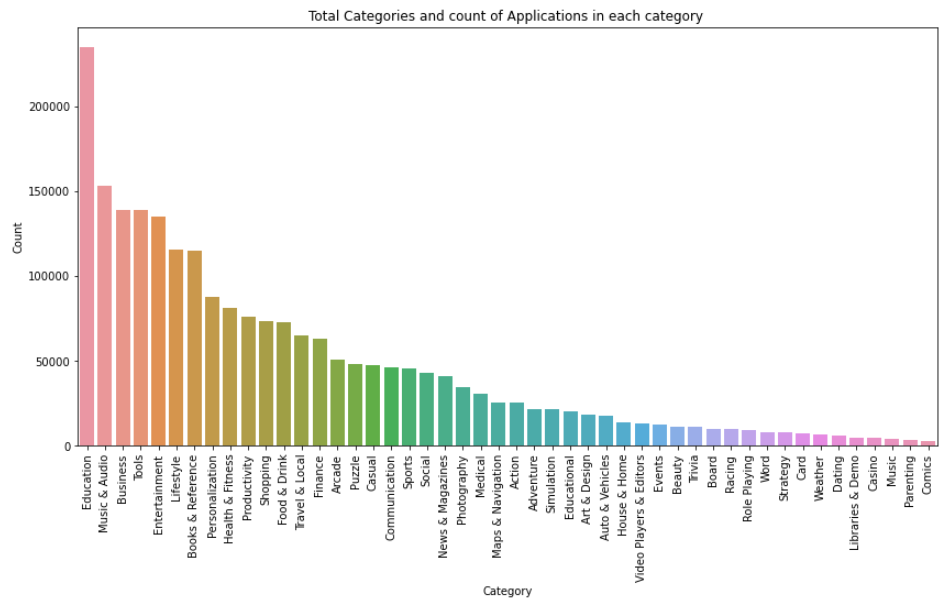
전체 카테고리 및 카테고리별 앱 개수 시각화
plt.figure(figsize=(14,7))
plt.xticks(rotation=90)
plt.xlabel("Category")
plt.ylabel("Number of applications")
plt.title("Total Categories and count of Applications in each category ")
sns.barplot(x = top_Category_installs.Category, y = top_Category_installs.Count)
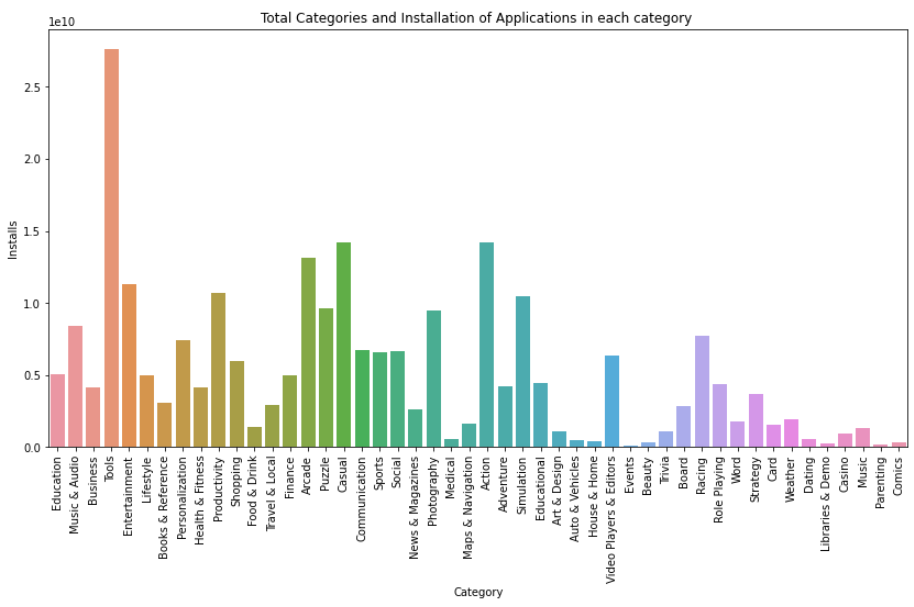
전체 카테고리 및
각 카테고리에 설치된 애플리케이션 시각화
plt.figure(figsize=(14,7))
plt.xticks(rotation=90)
plt.xlabel("Category")
plt.ylabel("Number of applications")
plt.title("Total Categories and Installation of Applications in each category ")
sns.barplot(x = top_Category_installs.Category,y = top_Category_installs.Installs)
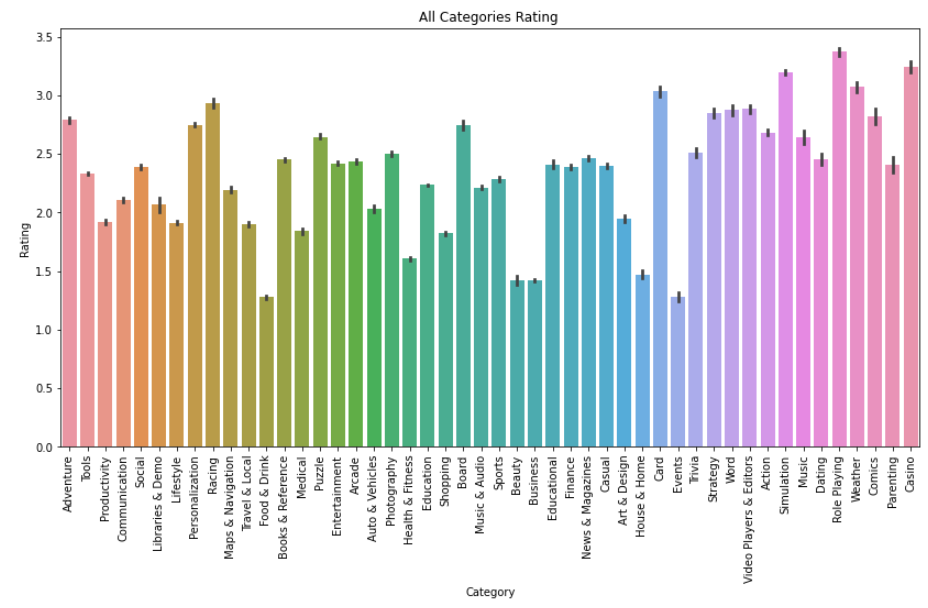
가장 높은 등급의 카테고리는 무엇입니까?
plt.figure(figsize=(14,7))
plt.xticks(rotation=90)
plt.xlabel("Highest Rated Category")
plt.ylabel("Number of applications")
plt.title("All Categories Rating ")
sns.barplot(x = googlePlaystoreData.Category,y = googlePlaystoreData.Rating)
애플리케이션의 크기는 앱 설치에 어떤 영향을 줍니까?
plt.figure(figsize=(8,8))
plt.title("Content Rating and Maximum installations ")
sns.scatterplot(x = 'Maximum Installs', y = 'Rating Count', data = googlePlaystoreData, hue = 'Content Rating')
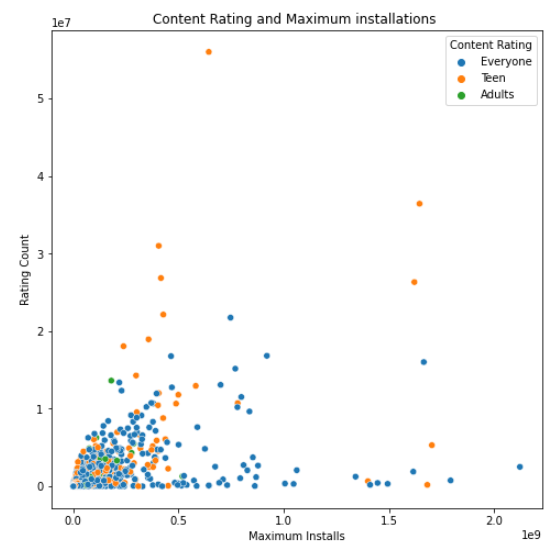
이 산점도는 플롯에서 모든 사람을 제외하고
10대 및 성인에 초점을 맞출 때
10대가 다운로드 및 평가 횟수 측면에서
많은 참여를 볼 수 있음을 보여줍니다.
가장 높은 유료 및 무료 앱이 있는
카테고리는 무엇입니까?
app_count = (googlePlaystoreData.groupby(['Category','Type'])[['App Name']]
.count()
.reset_index()
.rename(columns={'App Name':'Count','index':'App Name'}))
df_app_count = app_count.pivot('Category', 'Type', 'Count').fillna(0).reset_index()
df_app_count.set_index('Category').plot(kind='bar', stacked=True, figsize=(18,9))
plt.xlabel("Category", fontsize=15)
plt.ylabel("Count", fontsize=15)
plt.title("Free and Paid Apps in Category")
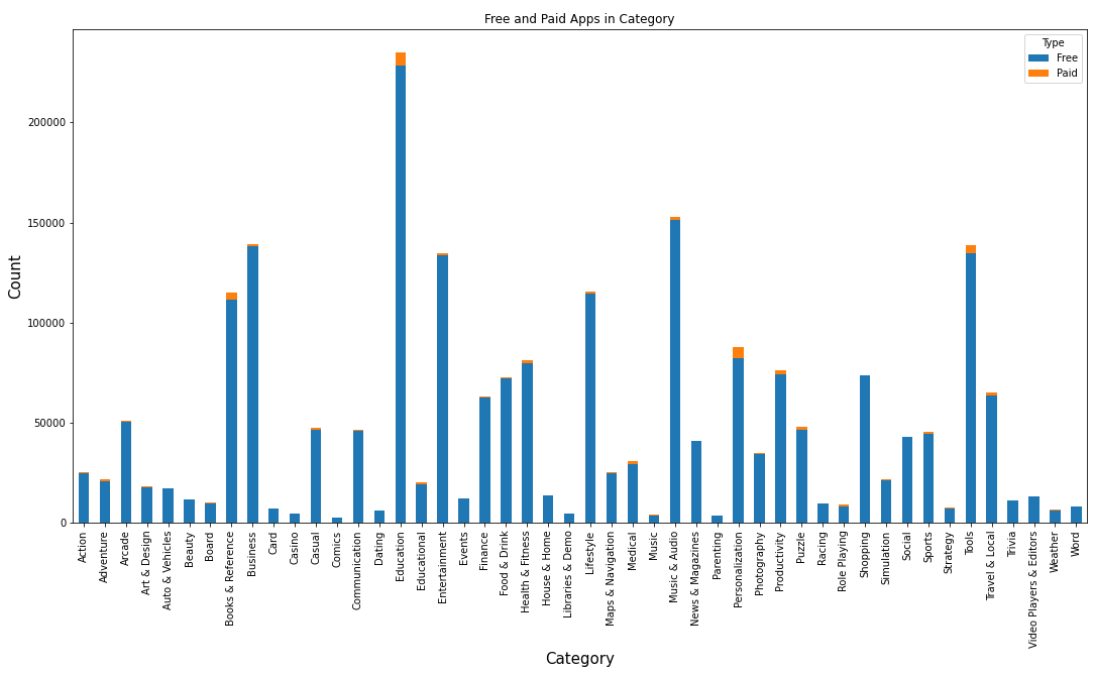
특정 앱 카테고리에는 다른 카테고리보다
다운로드할 수 있는 무료 앱이 더 많은 것 같습니다.
비즈니스, 교육, 음악 및 오디오, 도구 및 소셜 카테고리의
대부분의 앱은 무료로 설치할 수 있었습니다.
동시에 Books & References, Education, Tools, Personalization
카테고리는 설치에 사용할 수 있는
유료 앱의 수가 가장 많았습니다.
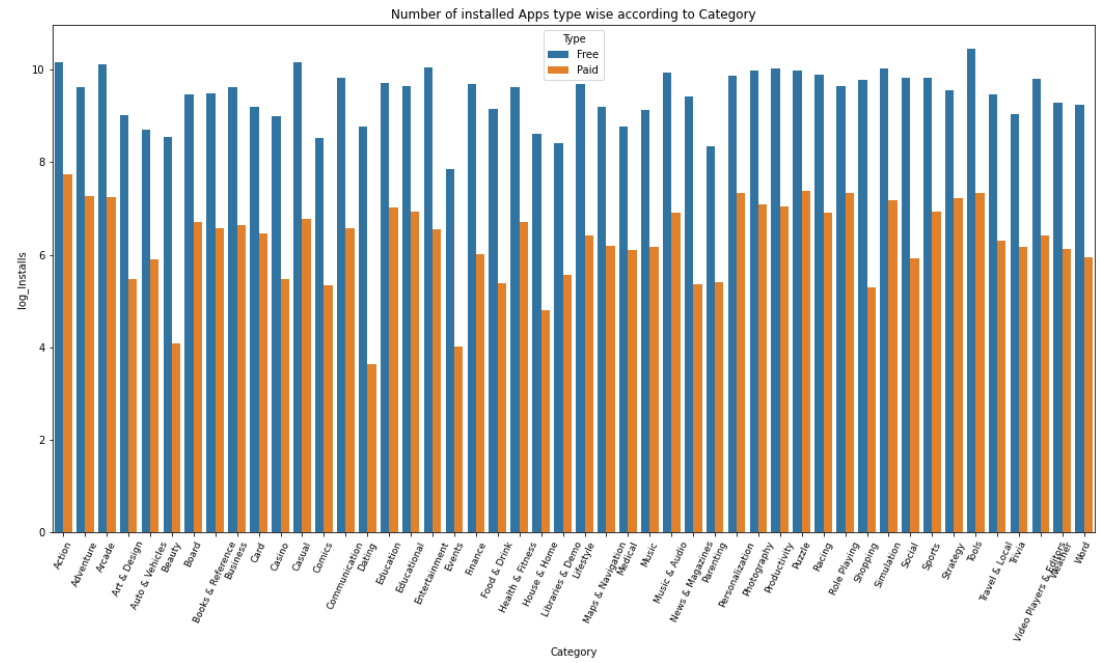
각 범주의 설치 유형 시각화
설치 수의 편차가 크므로 이 열에 대한
로그 값을 사용할 수 있도록 줄여야 합니다.
그렇지 않으면 시각화할 때
데이터를 볼 수 없습니다.
categoty_type_installs = googlePlaystoreData.groupby(['Category','Type'])[['Installs']].sum().reset_index()
categoty_type_installs['log_Installs'] = np.log10(categoty_type_installs['Installs'])
plt.figure(figsize=(18,9))
plt.xticks(rotation=65,fontsize=9)
plt.xlabel("Category")
plt.ylabel("Installs")
plt.title("Number of installed Apps type wise according to Category")
sns.barplot(x = 'Category', y = 'log_Installs', hue='Type', data=categoty_type_installs)
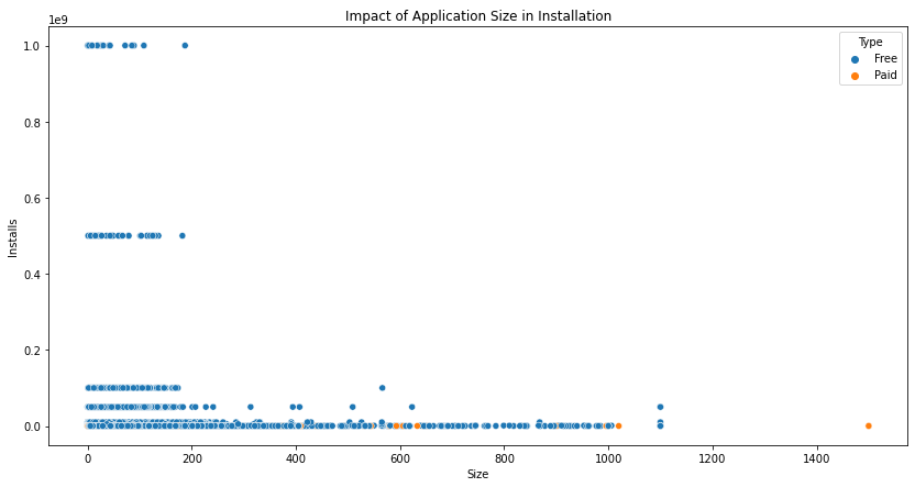
응용 프로그램의 크기는 설치에 어떤 영향을 줍니까?
plt.figure(figsize=(14,7))
plt.xlabel("Size")
plt.ylabel("Installs")
plt.title("Impact of Application Size in Installation")
sns.scatterplot(x = 'Size',y = 'Installs', hue='Type', data=googlePlaystoreData)
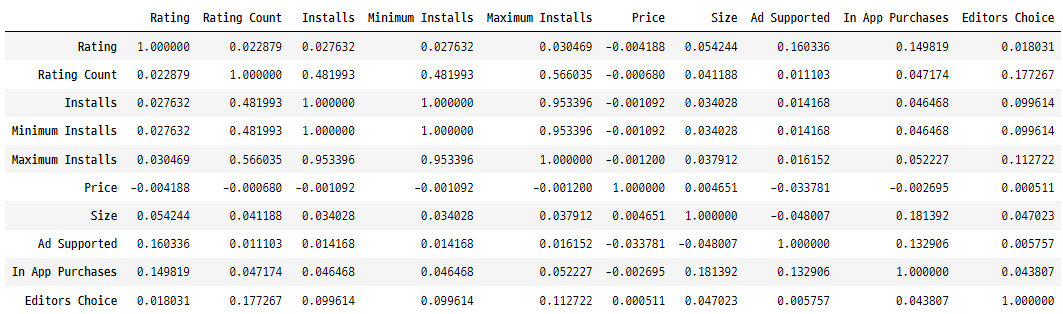
변수들 간 상관관계 구하기
googlePlaystoreData.corr()
plt.figure(figsize=(8,6))
sns.heatmap(googlePlaystoreData.corr(),cbar= True, cmap='coolwarm')
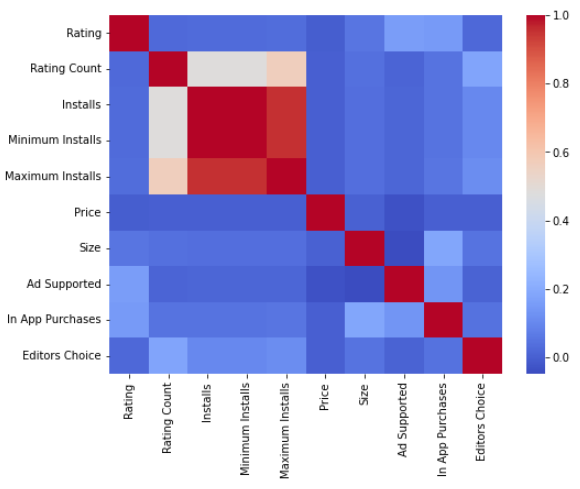
AdSupport 및 InappPurchases와 같은 요소는
앱 등급과 관련이 있습니다.
앱이 고객 지원을 제공하고 구독 계획이 있으면
더 많은 고객을 참여시킬 수 있다고 말할 수 있습니다.
편집자의 선택도 중요한 역할을 한다는 것을
같은 그래프에서 확인할 수 있습니다.
편집자의 선택이 높으면
높은 평점과 높은 설치 수를 볼 수 있습니다.
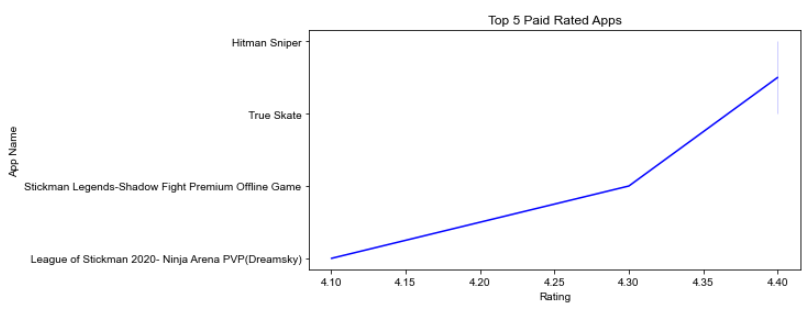
가장 높은 평가 및 설치를 기반으로 한
상위 5개 유료 앱은 무엇입니까?
paid_apps = googlePlaystoreData[(googlePlaystoreData.Type=='Paid') &
(googlePlaystoreData.Installs >= 5000000)]
paid_apps = paid_apps.groupby('App Name')['Rating'].max().sort_values(ascending = False)
plt.figure(figsize=(8,4))
plt.xlabel("Rating")
sns.set_theme(style="whitegrid")
plt.title("Top 5 Paid Rated Apps")
sns.lineplot(x=paid_apps.values,y=paid_apps.index,color='Blue')
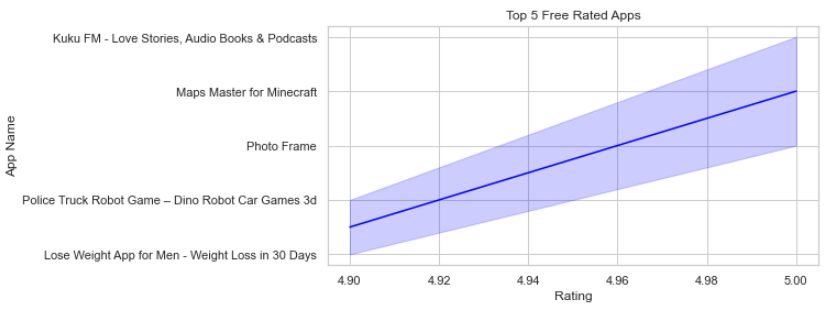
가장 높은 평가 및 설치를 기반으로 한
상위 5개 무료 앱은 무엇입니까?
free_apps = googlePlaystoreData[(googlePlaystoreData.Type=='Free') &
(googlePlaystoreData.Installs >= 5000000)]
free_apps = free_apps.groupby('App Name')['Rating'].max().sort_values(ascending = False)
free_apps = free_apps.head(5)
plt.figure(figsize=(8,4))
plt.xlabel("Rating")
sns.set_theme(style="whitegrid")
plt.title("Top 5 Free Rated Apps")
sns.lineplot(x = free_apps.values, y = free_apps.index,color = 'Blue')
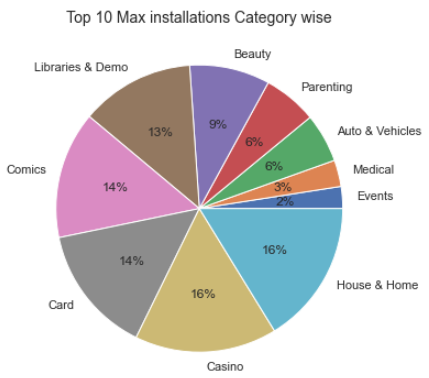
상위 10개의 최대 설치가 있는 범주를 원형 차트로 시각화
plt.figure(figsize=(8,6))
data = googlePlaystoreData.groupby('Category')['Maximum Installs'].max().sort_values(ascending = True)
data = data.head(10)
labels = data.keys()
plt.pie(data, labels= labels,autopct='%.0f%%')
plt.title("Top 10 Max installations Category wise", fontsize=14)
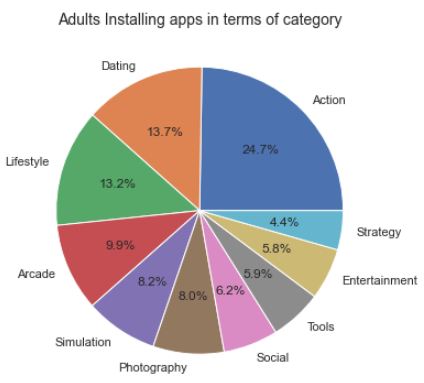
성인이 가장 많이 설치한 상위 10개 설치 카테고리를 원형 차트로 시각화
plt.figure(figsize=(8,6))
Adult = googlePlaystoreData[(googlePlaystoreData['Content Rating']=='Adults')]
Adult = Adult.groupby(['Category'])['Maximum Installs'].max().sort_values(ascending=False)
Adult = Adult.head(10)
labels = Adult.keys()
plt.pie(x = Adult, autopct="%.1f%%", labels=labels)
plt.title("Adults Installing apps in terms of category", fontsize=14)
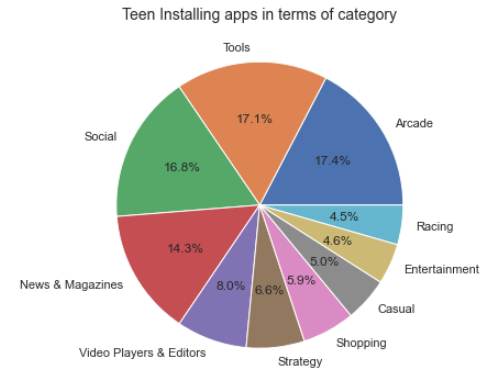
카테고리별로 앱을 설치하는 10대 비율 시각화
plt.figure(figsize=(8,6))
Teen = googlePlaystoreData[(googlePlaystoreData['Content Rating']=='Teen')]
Teen = Teen.groupby(['Category'])['Maximum Installs'].max().sort_values(ascending=False)
Teen = Teen.head(10)
labels = Teen.keys()
plt.pie(x = Teen, autopct="%.1f%%", labels=labels)
plt.title("Teen Installing apps in terms of category", fontsize=14)
결론
사람들은 게임 앱 설치에 더 많은 관심을 보이며
게임 앱에 최고 등급이 부여됩니다.
인앱 구매 기능은
평점과 좋은 상관관계를 가지고 있습니다.
따라서 앱이 고객 지원을 제공하고
구독 계획이 있다면 고객 참여에
도움이 될 것이라고 말할 수 있습니다.
대부분의 사람들은 등급을 부여하지 않지만
등급을 받은 사람들은 4+ 등급을
가장 많이 주는 경향이 있습니다.
대부분의 성인은
소셜 및 커뮤니케이션 앱을 설치했습니다.
대부분의 설치는 십대들이 수행하며
대부분은 비디오 플레이어 및 편집자입니다.
비디오 플레이어와 편집자는
더 많은 수요가 있습니다.
응용 프로그램의 크기는 설치에 따라 다릅니다.
사람들은 대부분 무료 앱을 다운로드했습니다.
무료 앱의 설치가 높고 무료 앱의 가용성도 매우 높습니다.
이상으로 캐글 데이터를 이용해서
데이터 탐색 및 시각화에 대한
전체적인 프로세스에 대해서
알아보았습니다.