데이터를 분석 경험이 있으신 분들은
'groupby'가 가장 많이 사용되는
함수 중 하나라는 것에 모두 동의하실 겁니다.
그래서 이번 포스팅에서는
groupby를 사용하는 방법과
이와 연관된 Grouper의 활용법에 대해
살펴보겠습니다.
비행기록과 관련된 데이터를 활용하겠습니다.
데이터는 R nycflights13 라이브러리에 있는
flights 데이터 입니다.
우선 Pandas와 Numpy를 임포트 하고,
데이터를 불러오겠습니다.
import pandas as pd
import numpy as np
flights = pd.read_csv("D:/Python_apply/flights.csv")
flights.shape

데이터는 약 33만개, feature는 19개 정도 있네요.
데이터에 대한 간단한 정보 확인해 볼게요.
flights.info()

그럼 데일리 시간대(time_hour)별로
총 연착된 시간(단위:분)을 구해 보겠습니다.
일반적인 방법과 출력은 아래와 같죠.
flights.groupby("time_hour")["arr_delay"].sum().reset_index()

데일리 말고, 월별로 집계해서 보고 싶으면
어떻게 해야 할까요?
바로 pd.Grouper() 함수를 사용하시면 됩니다.
flights.groupby(pd.Grouper(key = "time_hour", freq = 'M'))['arr_delay'].sum().reset_index()

어! 그런데, 에러가 발생하네요?
이는 key 인수인 "time_hour" feature가
datetime이 아니라, object형으로
정의되어 있기 때문입니다.
datetime형으로 변환하도록 할게요.
flights["time_hour"] = flights["time_hour"].astype(np.datetime64)
그리고, 다시 아래 문장을 실행해 보겠습니다.
flights.groupby(pd.Grouper(key = "time_hour", freq = 'M'))['arr_delay'].sum().reset_index()

월 단위 집계가 이루어졌네요!
위에서 잠시 설명한 것처럼,
key 인수는 datetime 열이어야 하고,
freq 인수는 월(M), 주(W), 3개월(3M), 연도(Y)
등과 같은 시간 빈도입니다.
참고로 아래 표는 freq 인수로 사용할 수 있는
시간 빈도입니다.
| Alias | Description |
| B | business day frequency |
| C | custom business day frequency |
| D | calendar day frequency |
| W | weekly frequency |
| M | month end frequency |
| SM | semi-month end frequency (15th and end of month) |
| BM | business month end frequency |
| CBM | custom business month end frequency |
| MS | month start frequency |
| SMS | semi-month start frequency (1st and 15th) |
| BMS | business month start frequency |
| CBMS | custom business month start frequency |
| Q | quarter end frequency |
| BQ | business quarter end frequency |
| QS | quarter start frequency |
| BQS | business quarter start frequency |
| A, Y | year end frequency |
| BA, BY | business year end frequency |
| AS, YS | year start frequency |
| BAS, BYS | business year start frequency |
| BH | business hour frequency |
| H | hourly frequency |
| T, min | minutely frequency |
| S | secondly frequency |
| L, ms | milliseconds |
| U, us | microseconds |
| N | nanoseconds |
추가로 여러 열에 대해서 여러 측정값을
추가하려면 어떻게 하면 될까요?
agg() 함수를 사용하시면 됩니다!
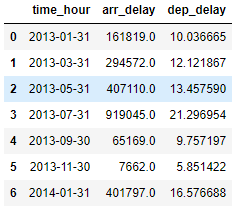
2개월 별
총 연발 시간 및 평균 연착 시간을
구해 보겠습니다.
(flights.groupby(pd.Grouper(key = "time_hour", freq = "2M"))[["arr_delay","dep_delay"]]
.agg({"arr_delay":"sum", "dep_delay":"mean"}) .reset_index())
agg() 함수는 딕셔너리 형태로
인수를 받습니다!
각 열에 대해 둘 이상의 측정값을
사용하기를 원하면,
딕셔너리 value값을 리스트 형태로
작성하시면 됩니다.
m2 = (flights.groupby(pd.Grouper(key = "time_hour", freq = "2M"))[["arr_delay","dep_delay"]]
.agg({"arr_delay":"sum", "dep_delay":["mean", "min", "max"]}) .reset_index())
m2
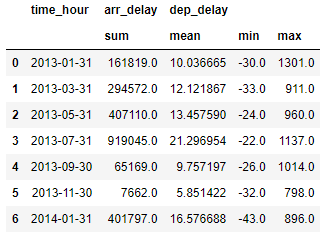
※ 참고로 연발 시간이 (-)인 경우는
예상 시간보다 빨리 출발한 것을 의미합니다.
위 형태와 같은 dataframe에서
feature 명은 무엇일까요?
m2.columns
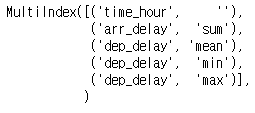
튜플 형식의 멀티 인덱스로 생성이 되네요.
한 단어로 변경할 수는 없을까요?
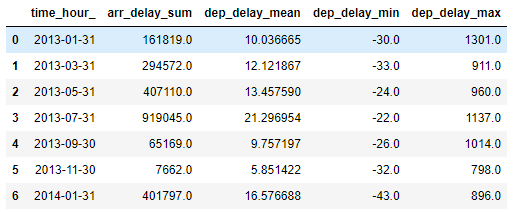
아래와 같은 방법으로
간단히 변경 가능합니다.
m2.columns = ['_'.join(var) for var in m2.columns]
m2
이상 groupby 및 Grouper에 대해서
알아보았습니다.
Grouper 함수. 알아두면 참 편리합니다!
'Python > Pandas' 카테고리의 다른 글
| 알아두면 유용한 pandas 단편 정보들 (0) | 2022.06.30 |
|---|---|
| Map(), Apply(), ApplyMap() 함수 사용 방법 (0) | 2022.06.11 |
| pandas value_counts() 함수 (0) | 2022.05.02 |
| Pandas 행 단위 연산 - iterrows(), itertuples(), iloc, loc 함수 (0) | 2022.03.09 |
| pandas rank() 함수 - 숫자 데이터의 순위 계산 함수 (0) | 2022.03.06 |


댓글